Poultry7 min read
Feed conversion ratio: the number most layer farms never calculate
Feed is roughly 70% of the cost of producing an egg. If you are not tracking kilograms of feed per kilogram of egg, you cannot know whether you are making money.
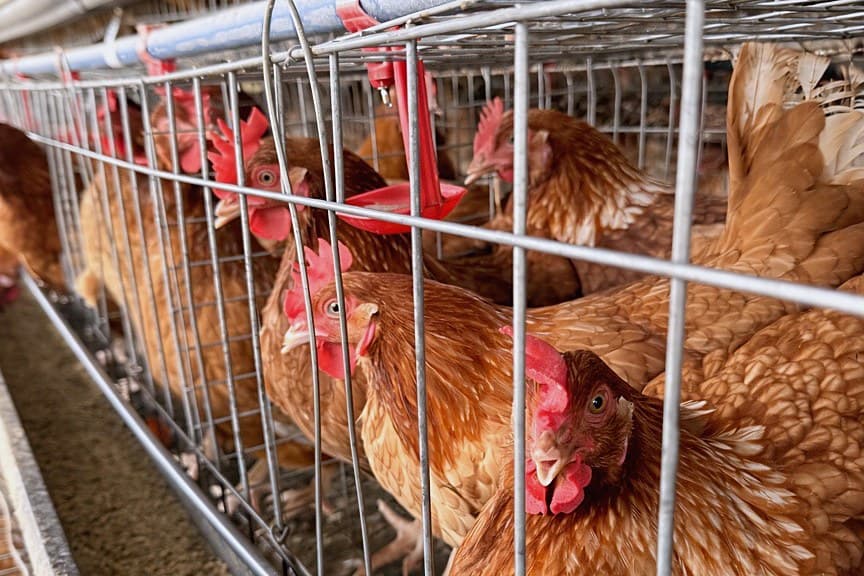
Ask a layer farmer how their birds are doing and you will usually be told the lay percentage. It is the obvious number: eggs today, divided by birds alive. It is also only half the picture, because it says nothing about what those eggs cost to produce.
Feed conversion ratio — FCR — closes that gap. It is kilograms of feed consumed divided by kilograms of egg mass produced. Lower is better. For ISA Brown layers in a cage system at peak production, the industry benchmark sits between 1.9 and 2.2.
Why it is the number that matters
Feed is roughly seventy percent of the running cost of a layer operation. A flock laying at a healthy percentage but eating inefficiently can be losing money while every visible indicator looks fine. FCR is the only routine measurement that catches that.
A flock can be laying well and still be unprofitable. Lay rate tells you about output. FCR tells you about the business.
What the curve should look like
FCR is not a single target — it moves across the laying cycle, and knowing the shape of the curve is what lets you tell a real problem from a normal one.
- Around week 20, as the flock comes into lay, daily FCR is high — often above 5. This is normal. The birds are eating to grow as well as to lay.
- By week 25 it should be approaching 2.0 as production accelerates.
- Weeks 28 to 31 are the optimal window: expect roughly 1.89 to 1.91 at peak.
- Weeks 35 to 47 should hold in the 1.91 to 1.95 range. Sustained efficiency here is what pays for the cycle.
- From around week 55 efficiency begins to slip. By week 68 an FCR of about 2.2 tells you to start watching egg revenue against feed cost closely.
- By week 80 to 90, FCR of 2.4 and above is the signal to make a decision: force moult, or depopulate.
How to actually measure it
You need two daily numbers: total feed issued to the house, and total egg mass collected. Egg mass, not egg count — weigh a sample crate and multiply, or weigh the day's collection directly. Divide feed by egg mass and you have the day's FCR. Keep a running cumulative figure alongside it; the daily number is noisy, the cumulative number is the truth.
Most farms stop here because it feels like paperwork. It is not paperwork — it is the difference between finding a problem in three days and finding it at the end of the cycle when the money is already gone.
What to do when FCR drifts up
- Check for feed wastage first. Overfilled troughs and spillage are the most common cause and the cheapest to fix.
- Check water. Birds that cannot drink freely eat less efficiently. Nipple drinkers should be tested, not assumed.
- Check for heat stress. Feed intake and shell quality both fall in sustained heat.
- Check the feed itself. A batch change with a different energy density will move FCR within days.
- Only then look at health. By the time disease shows in FCR, it usually shows elsewhere too.